Go to recent INPhobe...

2.01.2010

Where's the remotest place on Earth?

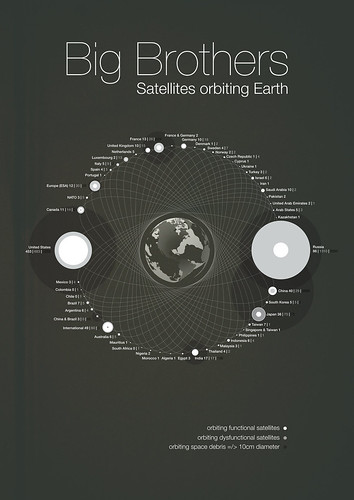
· Getting away from it all is easier said than done, as new maps of the world's connectedness reveal.
Where's the remotest place on Earth? - www.newscientist.com
[Click on image above to enlarge]
Very little of the world's land can now be thought of as inaccessible, according to a new map of connectedness.
The maps are based on a model which calculated how long it would take to travel to the nearest city of 50,000 or more people by land or water.
The model combines information on terrain and access to road, rail and river networks. It also considers how factors like altitude, steepness of terrain and hold-ups like border crossings slow travel.
Plotted onto a map, the results throw up surprises. First, less than 10% of the world's land is more than 48 hours of ground-based travel from the nearest city.
What's more, many areas considered remote and inaccessible are not as far from civilisation as you might think. In the Amazon, for example, extensive river networks and an increasing number of roads mean that only 20% of the land is more than two days from a city - around the same proportion as Canada's Quebec province.
[Source: www.newscientist.com]

Big Brothers - Satellites Orbiting Earth

http://www.flickr.com/photos/michaelpaukner/4314987544/sizes/o/
Big Brothers: Satellites Orbiting Earth, Michael Paukner - www.flickr.com
[Click on image above to see the Hi-Res jpg]
[Source: www.flickr.com]

The World Government (2004)

http://utangente.free.fr/2004/wg2004.pdf
The World Government (2004) - utangente.free.fr
[Click on image above to see the Hi-Res pdf]
This map, entitled "The World Government", is an attempt to understand how world governance behaves, by analyzing its major contributors, from independent states, financial institutions, industrial firms, foundations, schools, universities, NGO's, international organizations, lobbyist groups, religious institutions, and others, in an endless network of influence. Dozens of icons represent each of these key players spread throughout the graph, while lines between them represent different types of ties. A special icon was created to characterize a percentage of property between elements.
[Source: utangente.free.fr]

Governing by Networks (2003)

· Info-Space, Info-War.
http://utangente.free.fr/2003/governingbynetworks.pdf
Governing by Networks (2003) - utangente.free.fr
[Click on image above to see Hi-Res pdf]
The American military network ARPAnet was conceived as a way to maintain uninterrupted communications in the event of nuclear war. Ancestor of the Internet and foundation of the Global Information Infrastructure, ARPAnet springs from exactly the same source as the "push-button war" that lay behind it: the change of scale provoked by the early 20th century discoveries in physics, within an industrial society capable of organizing the productivity - including the scientific productivity - of thousands of agents.
[Source: utangente.free.fr]
Reblog it with Zemanta...

Death & Taxes (2007)

· A visual guide to where US tax dollars go.
http://mibi.deviantart.com/art/Death-and-Taxes-2007-39894058
Death & Taxes (2007) - mibi.deviantart.com
[Click on image above to see Hi-Res jpg]
All budget figures are from the Office of Management and Budget (Whitehouse.gov/omb/) with supplementary military data from the department of Defense (DoD.mil) and the Center for Defense Information (CDI.org). The DoD is under congressional control and thus, as a governmental department, was placed on the right side of the graph. However, for the purpose of this chart, the DoD is on the left as the total is divided into military and non-military spending.
[Source: mibi.deviantart.com]
Reblog it with Zemanta...

Alice's Adventures in Wonderland - TextArc

http://www.textarc.org/Alice2.html
Alice's Adventures in Wonderland - www.textarc.org
[Click on image above to launch TextArc application]
TextArc: Revealing Word Associations, Distribution and Frequency. TextArc is a tool designed to help people discover patterns and concepts in any text by leveraging a powerful, underused resource: human visual processing. It compliments approaches such as statistical Natural Language Processing and Computational Linguistics by providing an overview, letting intuition help extract meaning from an unread text. Here, an analysis of Lewis Carroll's Alice in Wonderland demonstrates TextArc's structure and some capabilities.
TextArc represents the entire text as two concentric spirals on the screen: each line is drawn in a tiny (one pixel tall) font around the outside, starting at the top; then each word is drawn in a more readable size. Important typographic features, like the mouse-tail shape of a poem at about two o'clock, can be seen because the tiny lines retain their formatting. Frequently used words stand out from the background more intensely.
[Source: www.textarc.org]
Reblog it with Zemanta...

Wikileaks on the Culture Show - 01.29.2010


Rosicrucian Science of Inititation


UFO Bulgaria, TV News Report


UFOs St. Helens, Merseyside - 02.01.2010